
TM10-3930-641-34-2
TEE TEST PROCEDURE FOR STEERING SYSTEM (CONT)
(Sheet 14 of 24)
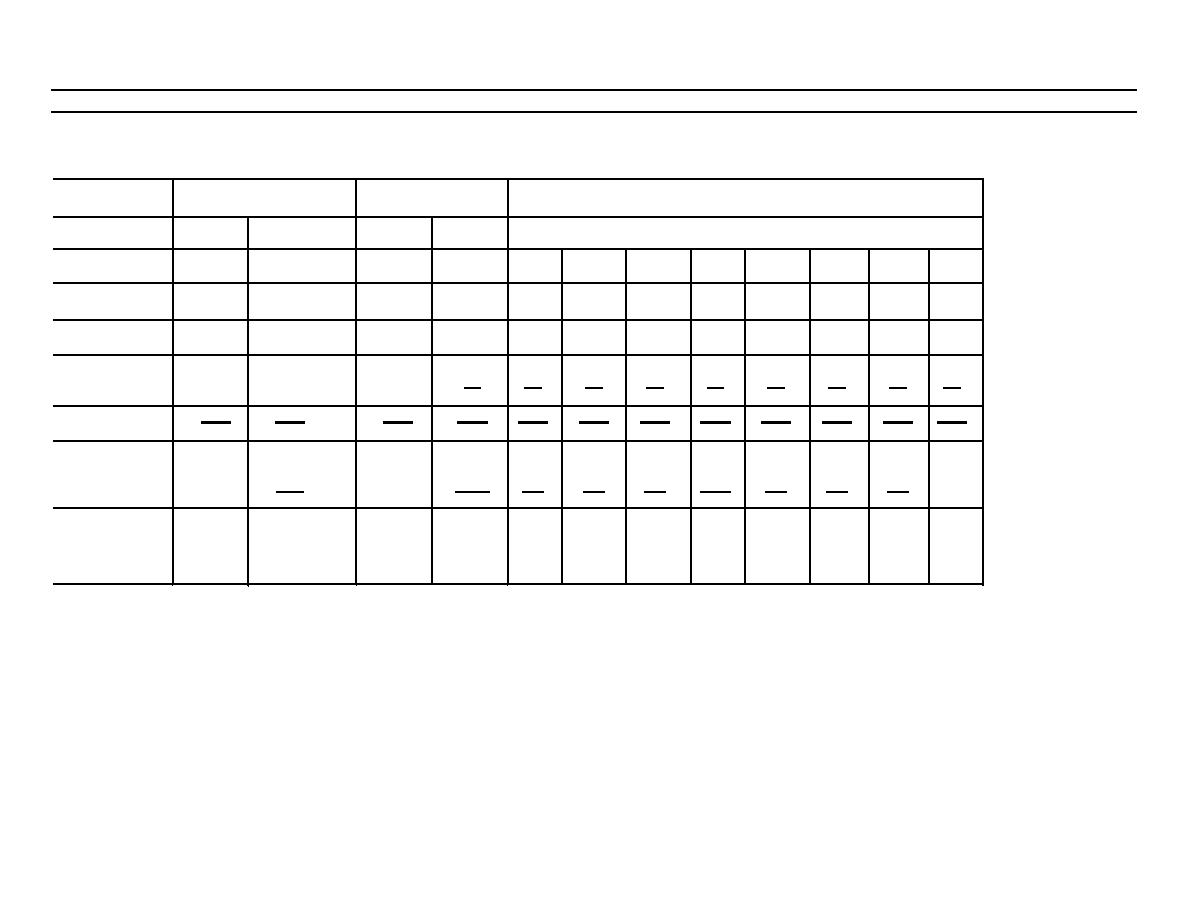
Compare the data from tests 7, 8, 9, 10, with this chart. The figures given on the chart represent maximum performance.
CHART B. PUMP TEST
Full Speed
Half Speed
Pump Flow
Pump Flow
Pump Test For Aeration And/Or Cavitation
Test
Low
High
Low
High
Name
Pressure Pressure
Pressure Pressure
Varied Speeds -- Constant Pressure
Test
7
8
9
10
11
12
13
14
15
16
17
18
Number
Engine
2000
2000
1000
1000
600
800
1000
1200
1400
1600
1800
2000
Speed
RPM
RPM
RPM
RPM
RPM
RPM
RPM
RPM
RPM
RPM
RPM
RPM
Pump Test
100
1000
100
1000
1000
1000
1000
1000
1000
1000
1000
1000
Pressure
PSI
PSI
PSI
PSI
PSI
PSI
PSI
PSI
PSI
PSI
PSI
PSI
150
150
150
150
150
150
150
150
150
150
150
150
Oil
5
5
5
5
5
5
5
5
5
5
5
5
Temperature
F
F
F
F
F
F
F
F
F
F
F
F
Test
90.0
81.0
45.0
35.0
17.0
26.0
35.0
44.0
54.0
63.0
72.0
81.0
Data
GPM
GPM
GPM
GPM
GPM
GPM
GPM
GPM
GPM
GPM
GPM
GPM
(7-8)
(9-10)
(11-12) (12-13) (13-14) (14-15) (15-16) (16-17) (17-18)
Flow
Differential
9.0*
10.0*
9.0
9.0
9.0
10.0
9.0
9.0
9.0
GPM
GPM
GPM
GPM
GPM
GPM
GPM
GPM
GPM
(14-15)x100
Percent
14
Flow Loss
10%
* Flow differential for Test 10 is normally more than the flow differential for Test 8 on gear-type pumps.
NOTE: Block steering valve return line to tank to do pump tests.
Go on to Sheet 15
6-110

